气象站总插件
插件图片
功能介绍
JSON代码:
{
"info": {
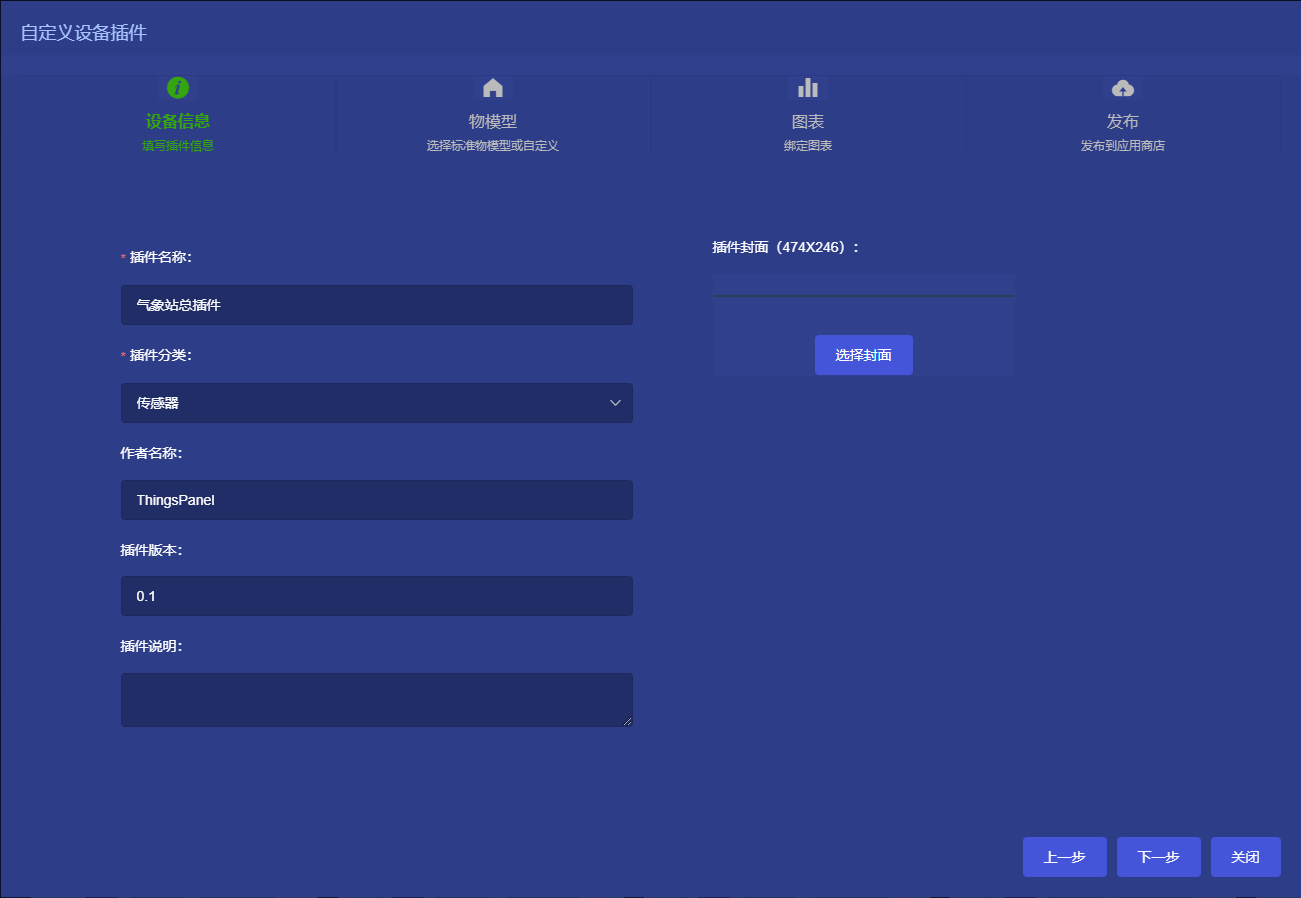
"pluginName": "气象站总插件",
"pluginCategory": "1",
"author": "ThingsPanel",
"version": "0.1"
},
"tsl": {
"properties": [
{
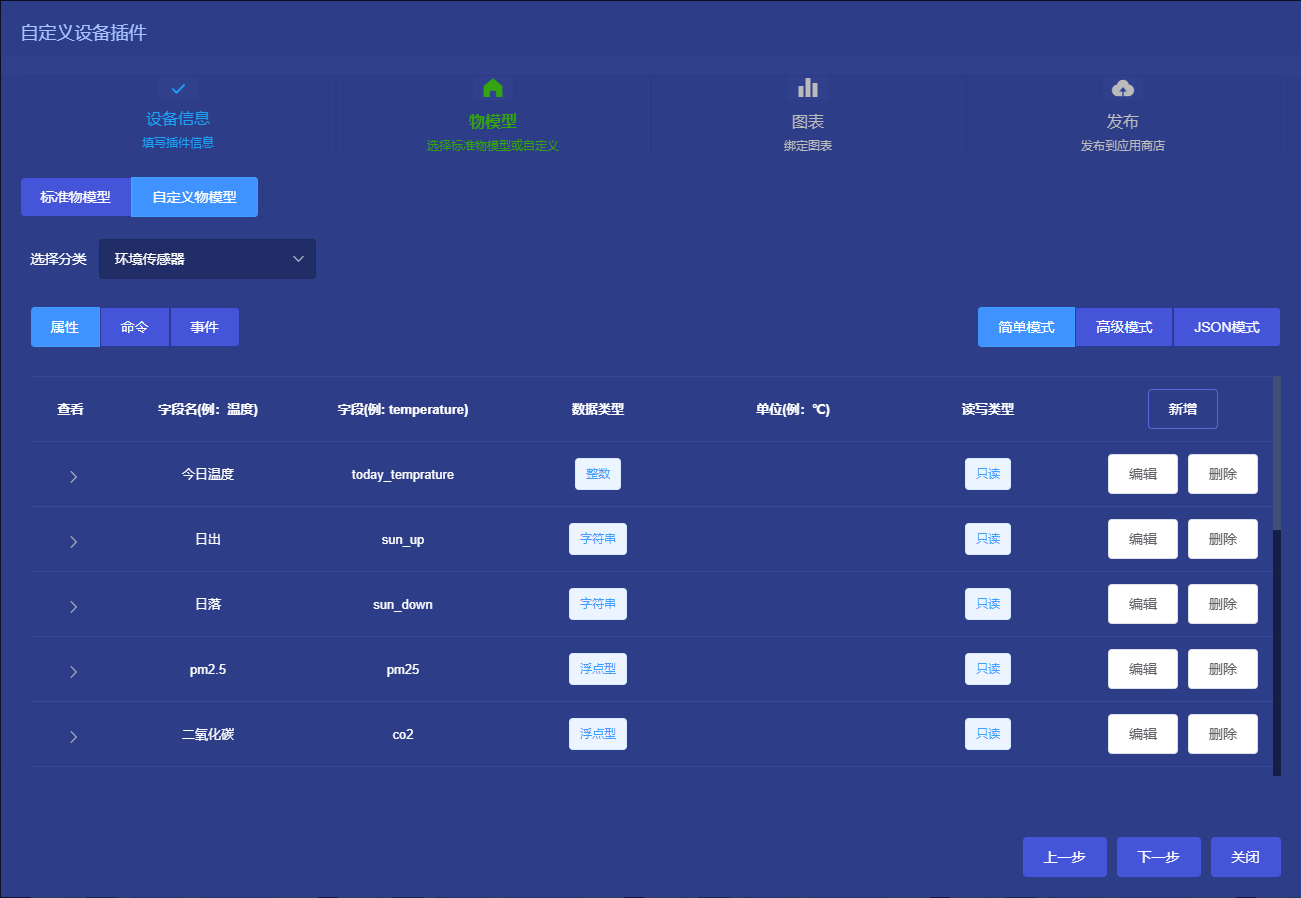
"dataType": "integer",
"dataRange": "0-999",
"stepLength": 0.1,
"readWrite": "r",
"name": "today_temprature",
"title": "今日温度"
},
{
"dataType": "text",
"dataRange": "0-999",
"stepLength": 0.1,
"readWrite": "r",
"title": "日出",
"name": "sun_up"
},
{
"dataType": "text",
"dataRange": "0-999",
"stepLength": 0.1,
"readWrite": "r",
"title": "日落",
"name": "sun_down"
},
{
"dataType": "float",
"dataRange": "0-999",
"stepLength": 0.1,
"readWrite": "r",
"title": "pm2.5",
"name": "pm25"
},
{
"dataType": "float",
"dataRange": "0-999",
"stepLength": 0.1,
"readWrite": "r",
"title": "二氧化碳",
"name": "co2"
},
{
"dataType": "float",
"dataRange": "0-999",
"stepLength": 0.1,
"readWrite": "r",
"title": "臭氧",
"name": "o3"
},
{
"dataType": "float",
"dataRange": "0-999",
"stepLength": 0.1,
"readWrite": "r",
"title": "二氧化硫",
"name": "so2"
},
{
"dataType": "float",
"dataRange": "0-999",
"stepLength": 0.1,
"readWrite": "r",
"title": "负氧",
"name": "o2"
},
{
"dataType": "float",
"dataRange": "0-999",
"stepLength": 0.1,
"readWrite": "r",
"title": "一氧化硫",
"name": "so"
},
{
"dataType": "float",
"dataRange": "0-999",
"stepLength": 0.1,
"readWrite": "r",
"title": "温度",
"name": "temprature"
},
{
"dataType": "float",
"dataRange": "0-999",
"stepLength": 0.1,
"readWrite": "r",
"title": "湿度",
"name": "humidity"
},
{
"dataType": "float",
"dataRange": "0-999",
"stepLength": 0.1,
"readWrite": "r",
"title": "降雨概率",
"name": "rainfall_probability"
},
{
"dataType": "float",
"dataRange": "0-999",
"stepLength": 0.1,
"readWrite": "r",
"title": "风速",
"name": "wind_speed"
},
{
"dataType": "float",
"dataRange": "0-999",
"stepLength": 0.1,
"readWrite": "r",
"title": "气压",
"name": "air_pressure"
},
{
"dataType": "float",
"dataRange": "0-999",
"stepLength": 0.1,
"readWrite": "r",
"title": "紫外线",
"name": "ultraviolet"
}
],
"option": {
"classify": "custom",
"catValue": "ambient_sensor"
}
},
"chart": [
{
"tooltip": {
"formatter": "{a} <br/>{b} : {c}%"
},
"series": [
{
"name": "Pressure",
"type": "gauge",
"startAngle": 200,
"endAngle": -20,
"center": [
"50%",
"65%"
],
"radius": "95%",
"min": 0,
"max": 60,
"axisTick": {
"show": true,
"splitNumber": 2,
"length": 2,
"lineStyle": {
"color": "#ddd"
}
},
"splitLine": {
"show": false,
"length": 10,
"lineStyle": {
"color": "auto"
}
},
"axisLabel": {
"show": true,
"distance": 12,
"textStyle": {
"color": "#fff",
"fontSize": 12
}
},
"axisLine": {
"lineStyle": {
"width": 6,
"color": [
[
0.3,
"#67e0e3"
],
[
0.7,
"#37a2da"
],
[
1,
"#fd666d"
]
]
}
},
"progress": {
"show": true,
"width": 8,
"itemStyle": {
"color": "#63e33d"
}
},
"pointer": {
"show": true,
"width": 3,
"itemStyle": {
"color": "#63e33d"
}
},
"detail": {
"formatter": "{value}",
"fontSize": 30,
"color": "#63e33d"
},
"data": [
{
"value": 0,
"name": ""
}
]
}
],
"simulator": {
"funcArr": [
"return +(Math.random() * 60).toFixed(2);"
],
"interval": 5000
},
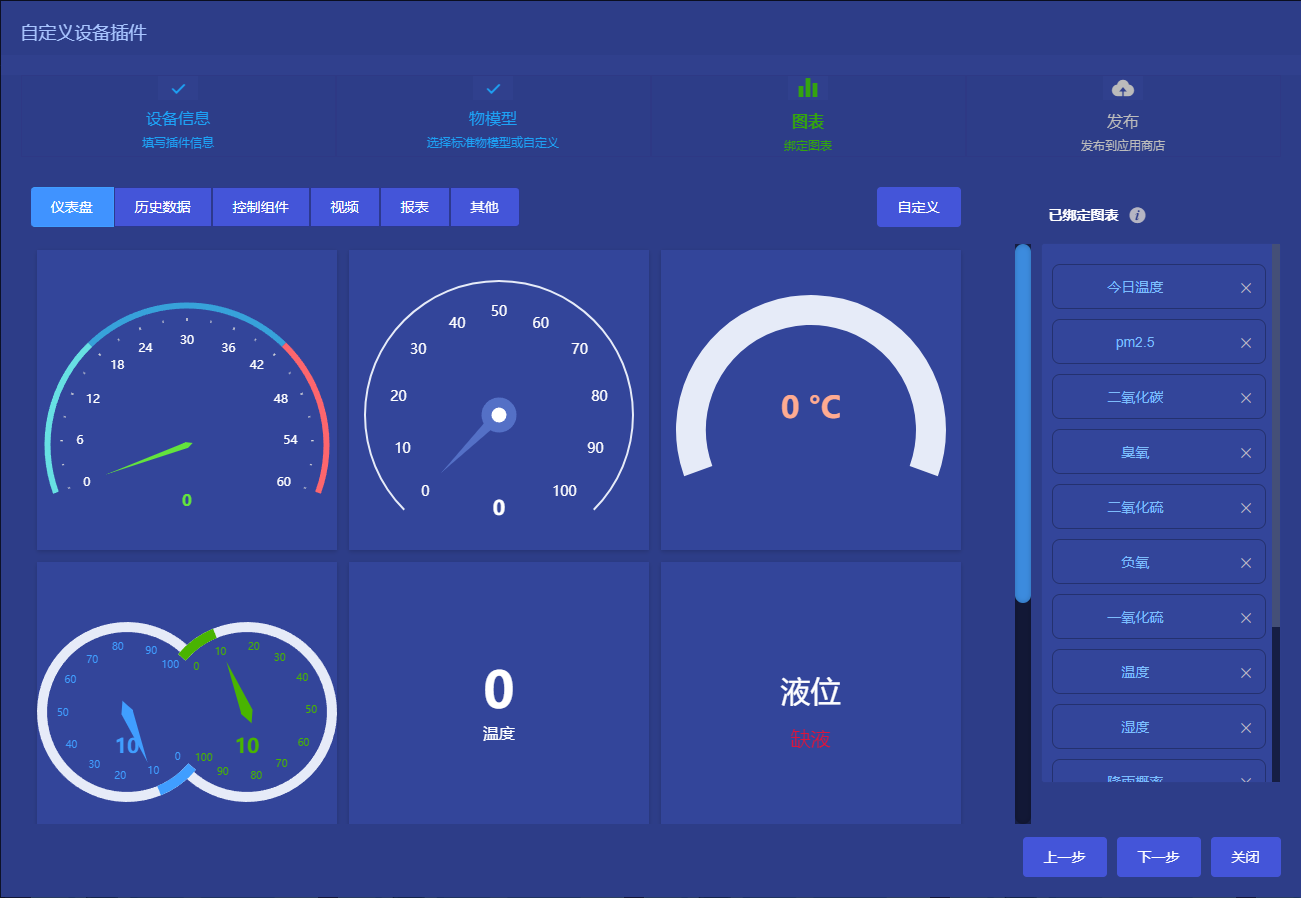
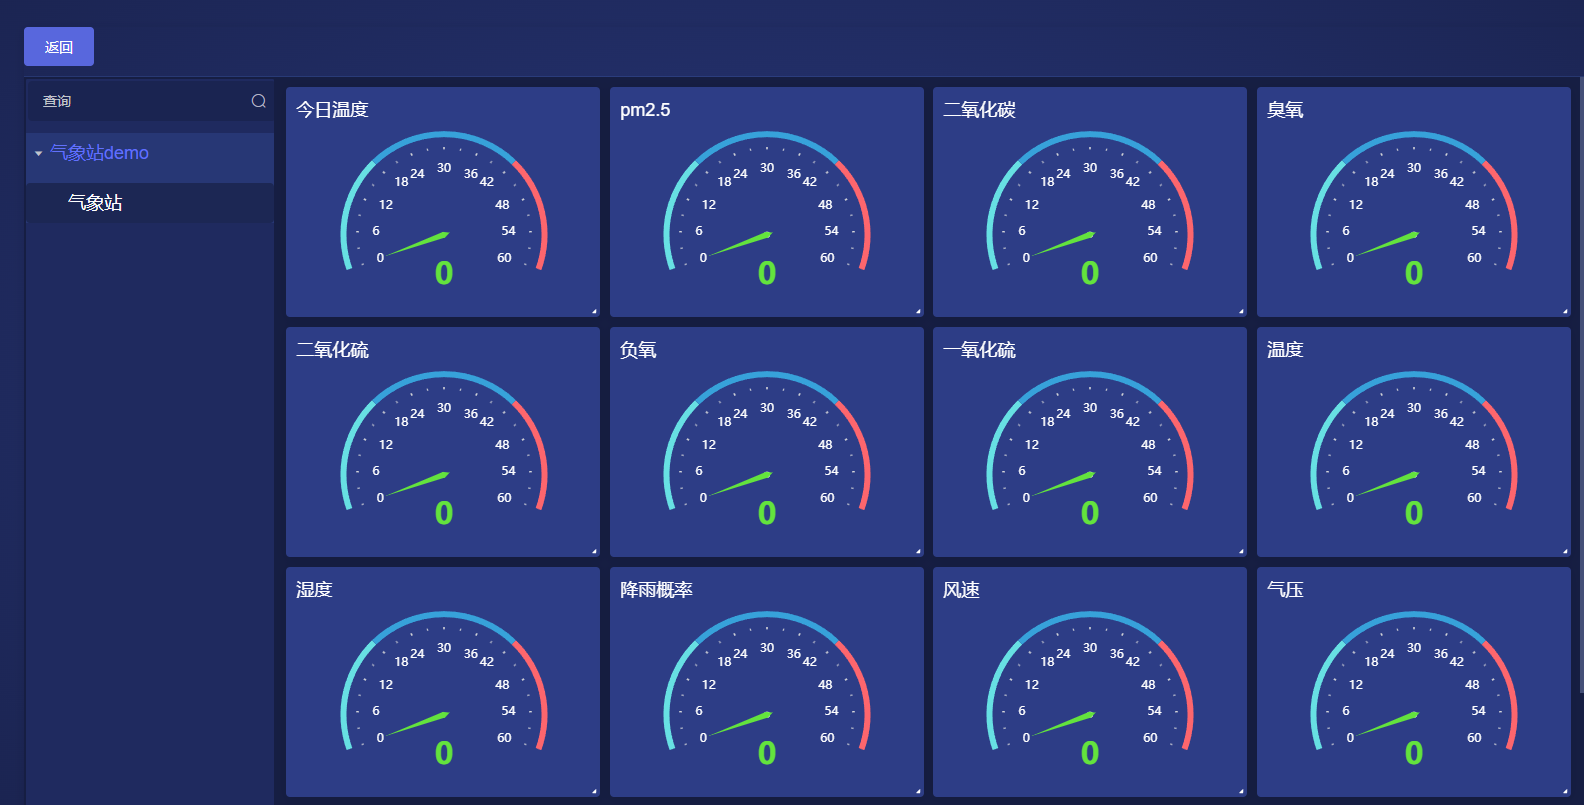
"name": "今日温度",
"mapping": [
"today_temprature"
],
"controlType": "dashboard",
"style": {
"backgroundColor": "#2d3d86",
"opacity": 1
},
"id": "EvvT7jzUWNte"
},
{
"tooltip": {
"formatter": "{a} <br/>{b} : {c}%"
},
"series": [
{
"name": "Pressure",
"type": "gauge",
"startAngle": 200,
"endAngle": -20,
"center": [
"50%",
"65%"
],
"radius": "95%",
"min": 0,
"max": 60,
"axisTick": {
"show": true,
"splitNumber": 2,
"length": 2,
"lineStyle": {
"color": "#ddd"
}
},
"splitLine": {
"show": false,
"length": 10,
"lineStyle": {
"color": "auto"
}
},
"axisLabel": {
"show": true,
"distance": 12,
"textStyle": {
"color": "#fff",
"fontSize": 12
}
},
"axisLine": {
"lineStyle": {
"width": 6,
"color": [
[
0.3,
"#67e0e3"
],
[
0.7,
"#37a2da"
],
[
1,
"#fd666d"
]
]
}
},
"progress": {
"show": true,
"width": 8,
"itemStyle": {
"color": "#63e33d"
}
},
"pointer": {
"show": true,
"width": 3,
"itemStyle": {
"color": "#63e33d"
}
},
"detail": {
"formatter": "{value}",
"fontSize": 30,
"color": "#63e33d"
},
"data": [
{
"value": 0,
"name": ""
}
]
}
],
"simulator": {
"funcArr": [
"return +(Math.random() * 60).toFixed(2);"
],
"interval": 5000
},
"name": "pm2.5",
"mapping": [
"pm25"
],
"controlType": "dashboard",
"style": {
"backgroundColor": "#2d3d86",
"opacity": 1
},
"id": "k9YpEfcaQt7m"
},
{
"tooltip": {
"formatter": "{a} <br/>{b} : {c}%"
},
"series": [
{
"name": "Pressure",
"type": "gauge",
"startAngle": 200,
"endAngle": -20,
"center": [
"50%",
"65%"
],
"radius": "95%",
"min": 0,
"max": 60,
"axisTick": {
"show": true,
"splitNumber": 2,
"length": 2,
"lineStyle": {
"color": "#ddd"
}
},
"splitLine": {
"show": false,
"length": 10,
"lineStyle": {
"color": "auto"
}
},
"axisLabel": {
"show": true,
"distance": 12,
"textStyle": {
"color": "#fff",
"fontSize": 12
}
},
"axisLine": {
"lineStyle": {
"width": 6,
"color": [
[
0.3,
"#67e0e3"
],
[
0.7,
"#37a2da"
],
[
1,
"#fd666d"
]
]
}
},
"progress": {
"show": true,
"width": 8,
"itemStyle": {
"color": "#63e33d"
}
},
"pointer": {
"show": true,
"width": 3,
"itemStyle": {
"color": "#63e33d"
}
},
"detail": {
"formatter": "{value}",
"fontSize": 30,
"color": "#63e33d"
},
"data": [
{
"value": 0,
"name": ""
}
]
}
],
"simulator": {
"funcArr": [
"return +(Math.random() * 60).toFixed(2);"
],
"interval": 5000
},
"name": "二氧化碳",
"mapping": [
"co2"
],
"controlType": "dashboard",
"style": {
"backgroundColor": "#2d3d86",
"opacity": 1
},
"id": "u74ethFaFTnP"
},
{
"tooltip": {
"formatter": "{a} <br/>{b} : {c}%"
},
"series": [
{
"name": "Pressure",
"type": "gauge",
"startAngle": 200,
"endAngle": -20,
"center": [
"50%",
"65%"
],
"radius": "95%",
"min": 0,
"max": 60,
"axisTick": {
"show": true,
"splitNumber": 2,
"length": 2,
"lineStyle": {
"color": "#ddd"
}
},
"splitLine": {
"show": false,
"length": 10,
"lineStyle": {
"color": "auto"
}
},
"axisLabel": {
"show": true,
"distance": 12,
"textStyle": {
"color": "#fff",
"fontSize": 12
}
},
"axisLine": {
"lineStyle": {
"width": 6,
"color": [
[
0.3,
"#67e0e3"
],
[
0.7,
"#37a2da"
],
[
1,
"#fd666d"
]
]
}
},
"progress": {
"show": true,
"width": 8,
"itemStyle": {
"color": "#63e33d"
}
},
"pointer": {
"show": true,
"width": 3,
"itemStyle": {
"color": "#63e33d"
}
},
"detail": {
"formatter": "{value}",
"fontSize": 30,
"color": "#63e33d"
},
"data": [
{
"value": 0,
"name": ""
}
]
}
],
"simulator": {
"funcArr": [
"return +(Math.random() * 60).toFixed(2);"
],
"interval": 5000
},
"name": "臭氧",
"mapping": [
"o3"
],
"controlType": "dashboard",
"style": {
"backgroundColor": "#2d3d86",
"opacity": 1
},
"id": "HKSzkleaGW8b"
},
{
"tooltip": {
"formatter": "{a} <br/>{b} : {c}%"
},
"series": [
{
"name": "Pressure",
"type": "gauge",
"startAngle": 200,
"endAngle": -20,
"center": [
"50%",
"65%"
],
"radius": "95%",
"min": 0,
"max": 60,
"axisTick": {
"show": true,
"splitNumber": 2,
"length": 2,
"lineStyle": {
"color": "#ddd"
}
},
"splitLine": {
"show": false,
"length": 10,
"lineStyle": {
"color": "auto"
}
},
"axisLabel": {
"show": true,
"distance": 12,
"textStyle": {
"color": "#fff",
"fontSize": 12
}
},
"axisLine": {
"lineStyle": {
"width": 6,
"color": [
[
0.3,
"#67e0e3"
],
[
0.7,
"#37a2da"
],
[
1,
"#fd666d"
]
]
}
},
"progress": {
"show": true,
"width": 8,
"itemStyle": {
"color": "#63e33d"
}
},
"pointer": {
"show": true,
"width": 3,
"itemStyle": {
"color": "#63e33d"
}
},
"detail": {
"formatter": "{value}",
"fontSize": 30,
"color": "#63e33d"
},
"data": [
{
"value": 0,
"name": ""
}
]
}
],
"simulator": {
"funcArr": [
"return +(Math.random() * 60).toFixed(2);"
],
"interval": 5000
},
"name": "二氧化硫",
"mapping": [
"so2"
],
"controlType": "dashboard",
"style": {
"backgroundColor": "#2d3d86",
"opacity": 1
},
"id": "H9wUyklen1Fh"
},
{
"tooltip": {
"formatter": "{a} <br/>{b} : {c}%"
},
"series": [
{
"name": "Pressure",
"type": "gauge",
"startAngle": 200,
"endAngle": -20,
"center": [
"50%",
"65%"
],
"radius": "95%",
"min": 0,
"max": 60,
"axisTick": {
"show": true,
"splitNumber": 2,
"length": 2,
"lineStyle": {
"color": "#ddd"
}
},
"splitLine": {
"show": false,
"length": 10,
"lineStyle": {
"color": "auto"
}
},
"axisLabel": {
"show": true,
"distance": 12,
"textStyle": {
"color": "#fff",
"fontSize": 12
}
},
"axisLine": {
"lineStyle": {
"width": 6,
"color": [
[
0.3,
"#67e0e3"
],
[
0.7,
"#37a2da"
],
[
1,
"#fd666d"
]
]
}
},
"progress": {
"show": true,
"width": 8,
"itemStyle": {
"color": "#63e33d"
}
},
"pointer": {
"show": true,
"width": 3,
"itemStyle": {
"color": "#63e33d"
}
},
"detail": {
"formatter": "{value}",
"fontSize": 30,
"color": "#63e33d"
},
"data": [
{
"value": 0,
"name": ""
}
]
}
],
"simulator": {
"funcArr": [
"return +(Math.random() * 60).toFixed(2);"
],
"interval": 5000
},
"name": "负氧",
"mapping": [
"o2"
],
"controlType": "dashboard",
"style": {
"backgroundColor": "#2d3d86",
"opacity": 1
},
"id": "G3tJZ867PPMR"
},
{
"tooltip": {
"formatter": "{a} <br/>{b} : {c}%"
},
"series": [
{
"name": "Pressure",
"type": "gauge",
"startAngle": 200,
"endAngle": -20,
"center": [
"50%",
"65%"
],
"radius": "95%",
"min": 0,
"max": 60,
"axisTick": {
"show": true,
"splitNumber": 2,
"length": 2,
"lineStyle": {
"color": "#ddd"
}
},
"splitLine": {
"show": false,
"length": 10,
"lineStyle": {
"color": "auto"
}
},
"axisLabel": {
"show": true,
"distance": 12,
"textStyle": {
"color": "#fff",
"fontSize": 12
}
},
"axisLine": {
"lineStyle": {
"width": 6,
"color": [
[
0.3,
"#67e0e3"
],
[
0.7,
"#37a2da"
],
[
1,
"#fd666d"
]
]
}
},
"progress": {
"show": true,
"width": 8,
"itemStyle": {
"color": "#63e33d"
}
},
"pointer": {
"show": true,
"width": 3,
"itemStyle": {
"color": "#63e33d"
}
},
"detail": {
"formatter": "{value}",
"fontSize": 30,
"color": "#63e33d"
},
"data": [
{
"value": 0,
"name": ""
}
]
}
],
"simulator": {
"funcArr": [
"return +(Math.random() * 60).toFixed(2);"
],
"interval": 5000
},
"name": "一氧化硫",
"mapping": [
"so"
],
"controlType": "dashboard",
"style": {
"backgroundColor": "#2d3d86",
"opacity": 1
},
"id": "b2MOfNMd8KX5"
},
{
"tooltip": {
"formatter": "{a} <br/>{b} : {c}%"
},
"series": [
{
"name": "Pressure",
"type": "gauge",
"startAngle": 200,
"endAngle": -20,
"center": [
"50%",
"65%"
],
"radius": "95%",
"min": 0,
"max": 60,
"axisTick": {
"show": true,
"splitNumber": 2,
"length": 2,
"lineStyle": {
"color": "#ddd"
}
},
"splitLine": {
"show": false,
"length": 10,
"lineStyle": {
"color": "auto"
}
},
"axisLabel": {
"show": true,
"distance": 12,
"textStyle": {
"color": "#fff",
"fontSize": 12
}
},
"axisLine": {
"lineStyle": {
"width": 6,
"color": [
[
0.3,
"#67e0e3"
],
[
0.7,
"#37a2da"
],
[
1,
"#fd666d"
]
]
}
},
"progress": {
"show": true,
"width": 8,
"itemStyle": {
"color": "#63e33d"
}
},
"pointer": {
"show": true,
"width": 3,
"itemStyle": {
"color": "#63e33d"
}
},
"detail": {
"formatter": "{value}",
"fontSize": 30,
"color": "#63e33d"
},
"data": [
{
"value": 0,
"name": ""
}
]
}
],
"simulator": {
"funcArr": [
"return +(Math.random() * 60).toFixed(2);"
],
"interval": 5000
},
"name": "温度",
"mapping": [
"temprature"
],
"controlType": "dashboard",
"style": {
"backgroundColor": "#2d3d86",
"opacity": 1
},
"id": "hT5ezOTaJtEj"
},
{
"tooltip": {
"formatter": "{a} <br/>{b} : {c}%"
},
"series": [
{
"name": "Pressure",
"type": "gauge",
"startAngle": 200,
"endAngle": -20,
"center": [
"50%",
"65%"
],
"radius": "95%",
"min": 0,
"max": 60,
"axisTick": {
"show": true,
"splitNumber": 2,
"length": 2,
"lineStyle": {
"color": "#ddd"
}
},
"splitLine": {
"show": false,
"length": 10,
"lineStyle": {
"color": "auto"
}
},
"axisLabel": {
"show": true,
"distance": 12,
"textStyle": {
"color": "#fff",
"fontSize": 12
}
},
"axisLine": {
"lineStyle": {
"width": 6,
"color": [
[
0.3,
"#67e0e3"
],
[
0.7,
"#37a2da"
],
[
1,
"#fd666d"
]
]
}
},
"progress": {
"show": true,
"width": 8,
"itemStyle": {
"color": "#63e33d"
}
},
"pointer": {
"show": true,
"width": 3,
"itemStyle": {
"color": "#63e33d"
}
},
"detail": {
"formatter": "{value}",
"fontSize": 30,
"color": "#63e33d"
},
"data": [
{
"value": 0,
"name": ""
}
]
}
],
"simulator": {
"funcArr": [
"return +(Math.random() * 60).toFixed(2);"
],
"interval": 5000
},
"name": "湿度",
"mapping": [
"humidity"
],
"controlType": "dashboard",
"style": {
"backgroundColor": "#2d3d86",
"opacity": 1
},
"id": "oY3MylyJdjwX"
},
{
"tooltip": {
"formatter": "{a} <br/>{b} : {c}%"
},
"series": [
{
"name": "Pressure",
"type": "gauge",
"startAngle": 200,
"endAngle": -20,
"center": [
"50%",
"65%"
],
"radius": "95%",
"min": 0,
"max": 60,
"axisTick": {
"show": true,
"splitNumber": 2,
"length": 2,
"lineStyle": {
"color": "#ddd"
}
},
"splitLine": {
"show": false,
"length": 10,
"lineStyle": {
"color": "auto"
}
},
"axisLabel": {
"show": true,
"distance": 12,
"textStyle": {
"color": "#fff",
"fontSize": 12
}
},
"axisLine": {
"lineStyle": {
"width": 6,
"color": [
[
0.3,
"#67e0e3"
],
[
0.7,
"#37a2da"
],
[
1,
"#fd666d"
]
]
}
},
"progress": {
"show": true,
"width": 8,
"itemStyle": {
"color": "#63e33d"
}
},
"pointer": {
"show": true,
"width": 3,
"itemStyle": {
"color": "#63e33d"
}
},
"detail": {
"formatter": "{value}",
"fontSize": 30,
"color": "#63e33d"
},
"data": [
{
"value": 0,
"name": ""
}
]
}
],
"simulator": {
"funcArr": [
"return +(Math.random() * 60).toFixed(2);"
],
"interval": 5000
},
"name": "降雨概率",
"mapping": [
"rainfall_probability"
],
"controlType": "dashboard",
"style": {
"backgroundColor": "#2d3d86",
"opacity": 1
},
"id": "WYQ5tG3H7TZy"
},
{
"tooltip": {
"formatter": "{a} <br/>{b} : {c}%"
},
"series": [
{
"name": "Pressure",
"type": "gauge",
"startAngle": 200,
"endAngle": -20,
"center": [
"50%",
"65%"
],
"radius": "95%",
"min": 0,
"max": 60,
"axisTick": {
"show": true,
"splitNumber": 2,
"length": 2,
"lineStyle": {
"color": "#ddd"
}
},
"splitLine": {
"show": false,
"length": 10,
"lineStyle": {
"color": "auto"
}
},
"axisLabel": {
"show": true,
"distance": 12,
"textStyle": {
"color": "#fff",
"fontSize": 12
}
},
"axisLine": {
"lineStyle": {
"width": 6,
"color": [
[
0.3,
"#67e0e3"
],
[
0.7,
"#37a2da"
],
[
1,
"#fd666d"
]
]
}
},
"progress": {
"show": true,
"width": 8,
"itemStyle": {
"color": "#63e33d"
}
},
"pointer": {
"show": true,
"width": 3,
"itemStyle": {
"color": "#63e33d"
}
},
"detail": {
"formatter": "{value}",
"fontSize": 30,
"color": "#63e33d"
},
"data": [
{
"value": 0,
"name": ""
}
]
}
],
"simulator": {
"funcArr": [
"return +(Math.random() * 60).toFixed(2);"
],
"interval": 5000
},
"name": "风速",
"mapping": [
"wind_speed"
],
"controlType": "dashboard",
"style": {
"backgroundColor": "#2d3d86",
"opacity": 1
},
"id": "DjbanGUG5t4e"
},
{
"tooltip": {
"formatter": "{a} <br/>{b} : {c}%"
},
"series": [
{
"name": "Pressure",
"type": "gauge",
"startAngle": 200,
"endAngle": -20,
"center": [
"50%",
"65%"
],
"radius": "95%",
"min": 0,
"max": 60,
"axisTick": {
"show": true,
"splitNumber": 2,
"length": 2,
"lineStyle": {
"color": "#ddd"
}
},
"splitLine": {
"show": false,
"length": 10,
"lineStyle": {
"color": "auto"
}
},
"axisLabel": {
"show": true,
"distance": 12,
"textStyle": {
"color": "#fff",
"fontSize": 12
}
},
"axisLine": {
"lineStyle": {
"width": 6,
"color": [
[
0.3,
"#67e0e3"
],
[
0.7,
"#37a2da"
],
[
1,
"#fd666d"
]
]
}
},
"progress": {
"show": true,
"width": 8,
"itemStyle": {
"color": "#63e33d"
}
},
"pointer": {
"show": true,
"width": 3,
"itemStyle": {
"color": "#63e33d"
}
},
"detail": {
"formatter": "{value}",
"fontSize": 30,
"color": "#63e33d"
},
"data": [
{
"value": 0,
"name": ""
}
]
}
],
"simulator": {
"funcArr": [
"return +(Math.random() * 60).toFixed(2);"
],
"interval": 5000
},
"name": "气压",
"mapping": [
"air_pressure"
],
"controlType": "dashboard",
"style": {
"backgroundColor": "#2d3d86",
"opacity": 1
},
"id": "d9hBxnOHurnX"
},
{
"tooltip": {
"formatter": "{a} <br/>{b} : {c}%"
},
"series": [
{
"name": "Pressure",
"type": "gauge",
"startAngle": 200,
"endAngle": -20,
"center": [
"50%",
"65%"
],
"radius": "95%",
"min": 0,
"max": 60,
"axisTick": {
"show": true,
"splitNumber": 2,
"length": 2,
"lineStyle": {
"color": "#ddd"
}
},
"splitLine": {
"show": false,
"length": 10,
"lineStyle": {
"color": "auto"
}
},
"axisLabel": {
"show": true,
"distance": 12,
"textStyle": {
"color": "#fff",
"fontSize": 12
}
},
"axisLine": {
"lineStyle": {
"width": 6,
"color": [
[
0.3,
"#67e0e3"
],
[
0.7,
"#37a2da"
],
[
1,
"#fd666d"
]
]
}
},
"progress": {
"show": true,
"width": 8,
"itemStyle": {
"color": "#63e33d"
}
},
"pointer": {
"show": true,
"width": 3,
"itemStyle": {
"color": "#63e33d"
}
},
"detail": {
"formatter": "{value}",
"fontSize": 30,
"color": "#63e33d"
},
"data": [
{
"value": 0,
"name": ""
}
]
}
],
"simulator": {
"funcArr": [
"return +(Math.random() * 60).toFixed(2);"
],
"interval": 5000
},
"name": "紫外线",
"mapping": [
"ultraviolet"
],
"controlType": "dashboard",
"style": {
"backgroundColor": "#2d3d86",
"opacity": 1
},
"id": "uPB976gehq4k"
}
],
"publish": {
"isPus": true
}
}什么是设备插件
同样的一个温湿度传感器,可能有上千个厂家,不同的规格型号,但是他们都是温湿度传感器。 温湿度传感器的输入是温度、湿度、时间。输出是当前温度、当前湿度、温度曲线、湿度曲线等图表单元或者报表。这些输入和输出的数量和彼此关系都是确定的。 因此,我们将温湿度传感器对应的软件部分也抽象成一个标准的温湿度传感器组件,这个组件包括了固定的数据输入和结果输出。并使之成为物联网大厦中的标准的砖块。
如何使用设备插件
1. 选择一个设备插件, 复制JSON代码。
2. 在ThingsPanel物联网平台中,点击“应用管理”,点击“设备插件生成器”,点击“导入插件”,把刚才拷贝的设备插件JSON代码粘贴进去,点击确定,然后刷新页面,就可以在已安装列表里看到刚才导入的插件了。
3. 在ThingsPanel物联网平台中,点击“设备接入”,点击“设备管理”,在设备上点击“绑定插件”对话框,输入设备插件的名称,在检索出的插件列表中找到刚才导入的设备插件,点击选择就绑定成功了。
插件信息
作者:
ThingsPanel
类别:
设备插件 - 传感器
版本号:
0.1
发布日期:
2023-08-11 17:17
该插件兼容的设备